Providing cutting edge analytics to fulfill the environmental assessment and monitoring requirements of our clients.
Forestry - arboSense
Forest extent and type
Leaf area index (LAI)
Tree canopy density (TCD)
Vegetation canopy height (VH)
Above ground biomass (AGB)
Canopy disturbance and recovery assessment
Wetlands
Wetland class and form classification
Wetland permanence assessment
Wetland wetness trend monitoring
Watershed characterization
Coastal Management
Mangrove extent & change
Mangrove canopy density & change
Aquaculture inventory
Coastal habitat assessment and monitoring
Climate change & nature-based solutions
Historical baseline assessment
Habitat degradation and disturbance monitoring
Restoration and rehabilitation planning and monitoring
Measurement, reporting, and verification (MRV) for REDD+
Energy
Energy corridor monitoring
Incident response and assessment
Habitat disturbance and reclamation monitoring
Hazards
Wildfire – rapid burned area and burn severity mapping (R-BAM)
Flood – rapid mapping and historical assessment
Natural disturbances (e.g., insects)
Analytic Service Examples
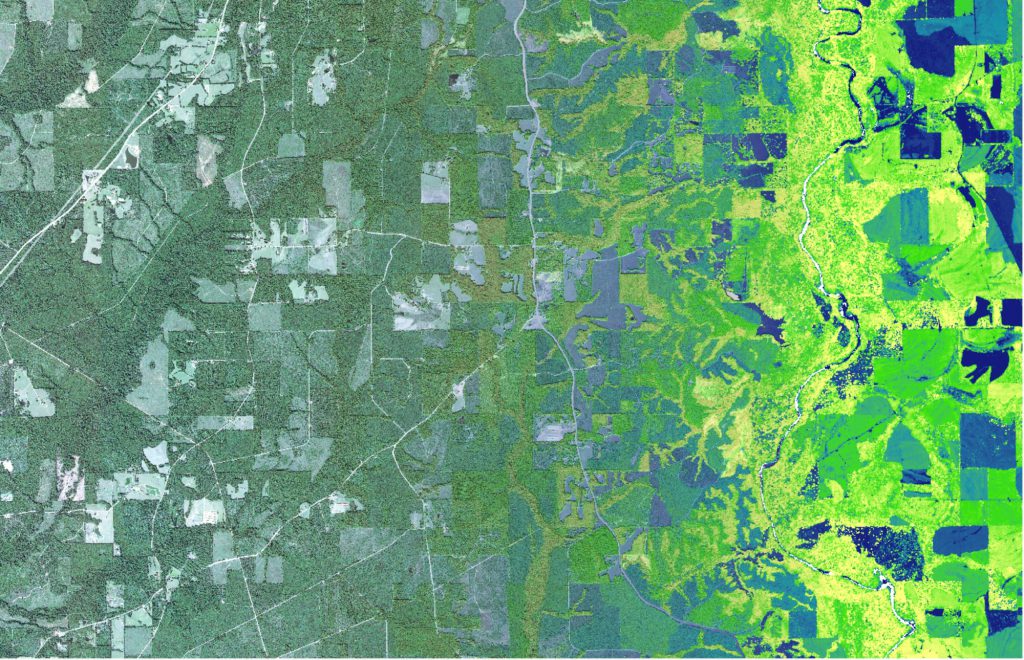
arboSense Leaf Area Index
LAI is a measure of the amount of leaf surface area per unit of ground surface area occupied by vegetation. It is a widely used vegetation parameter for characterizing various ecosystem processes, including phytomass production, water and nutrient uptake, and carbon flux. Our team of experts has developed a spatially-explicit model of LAI, leveraging the latest spaceborne optical and radar imagery, coupled with machine learning algorithms and multi-seasonal LAI field measurements. With our scalable cloud computing platform, we have applied our LAI model over a vast area of 16 million hectares of boreal forest in Northern Alberta, monthly between May and October for 2022. This helps researchers, stakeholders, and decision-makers in the forestry and environmental sectors to understand LAI and water balance in managed and unmanaged watersheds with great precision and accuracy.
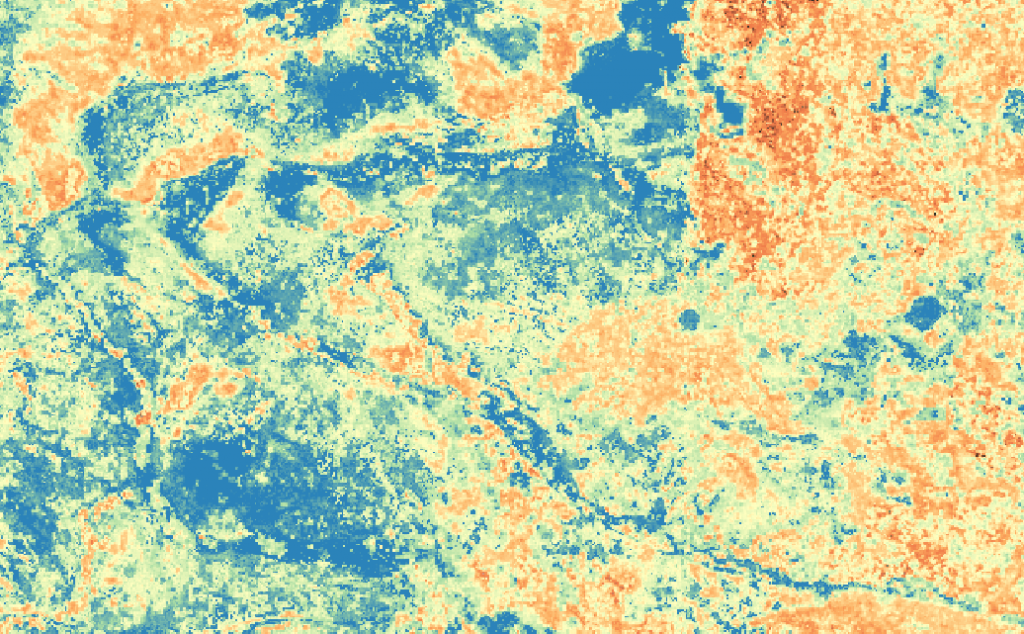
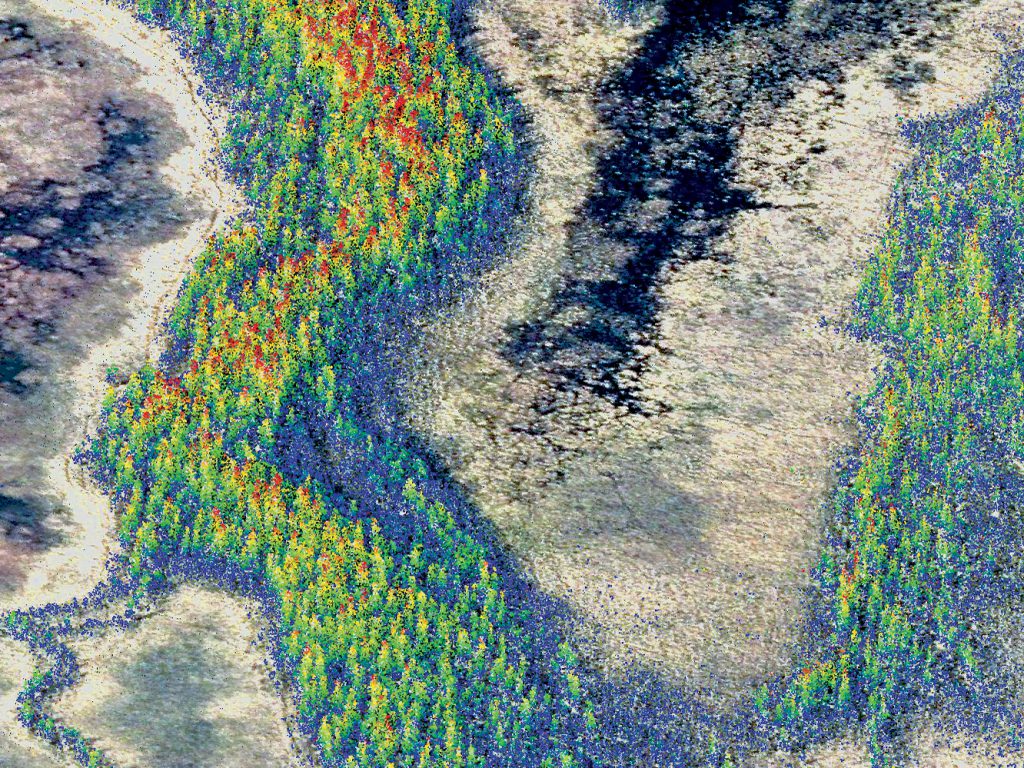
arboSense Vegetation Height
As an essential attribute in natural resources management, canopy height provides invaluable information about vegetation structure and forest growth. By estimating the height of the canopy, managers can assess the health and productivity of ecosystems and identify areas that may require intervention or protection. We leverage multi-spectral, Radar, and LiDAR data with machine learning methods to model and map canopy height as well as its changes over large areas using our cloud computing system. Our canopy height product has been tested in British Columbia and Alberta, shedding light on ecosystem health, carbon storage, and biodiversity conservation efforts. With additional data, our product can easily be extended to other areas.
arboSense Above Ground Biomass
AGB refers to the collective amount of dry plant matter that exists above the soil, including the trunks, stems, and leaves of vegetation. In the context of climate change, AGB is a crucial ecological indicator because it can offer insight into both plant productivity and carbon storage. To develop the most precise and dependable model for estimating AGB in the boreal forest, we utilized a combination of field data, airborne LiDAR data, and various satellite imagery. With the help of machine learning, we were able to develop a model that accurately estimates AGB in different ecosystems and land covers, providing valuable information on carbon stocks, ecosystem services, and the conservation of biodiversity.
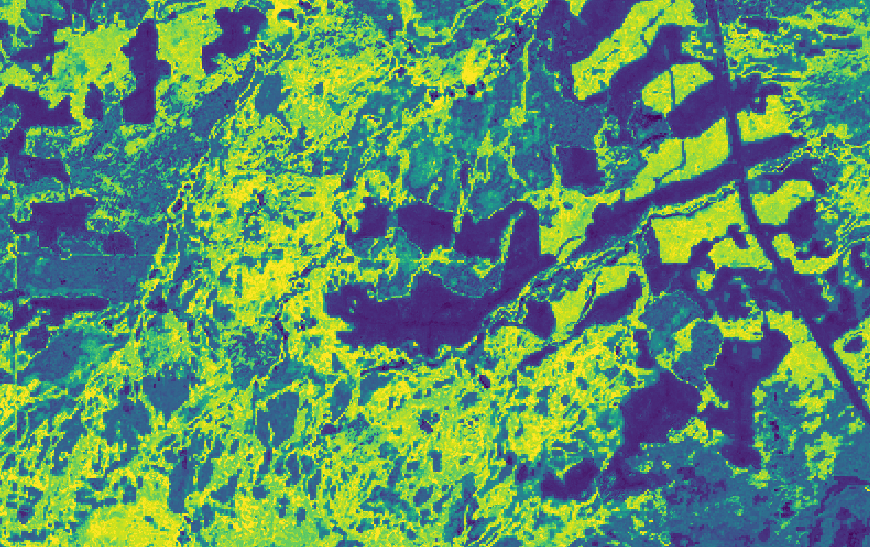
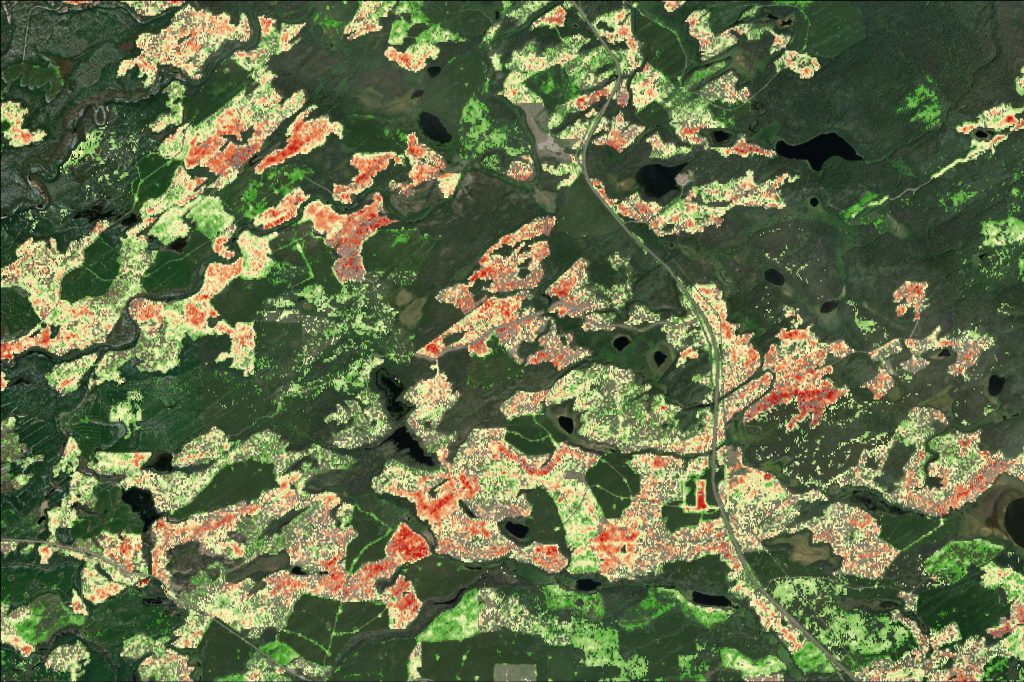
arboSense Tree Canopy Density
TCD product shows the tree canopy density in terms of projective cover in percent per pixel at a given point in time. TCD is directly derived from Sentinel-2 and Sentinel-1 satellite data using a locally calibrated supervised machine learning model. TCD can be used as input for generating Forest Area maps according to a National Forest Definition or other user requirements. It can be used to as an input for Land Use/ Land Cover classification, and to distinguish between intact forest, degraded forest, and regenerating forest, which makes it valuable for stakeholders involved in forest protection or restoration projects. Hatfield produces TCD products as part of the Earth Observation for Sustainable Development (EO4SD) Forest Management consortium.
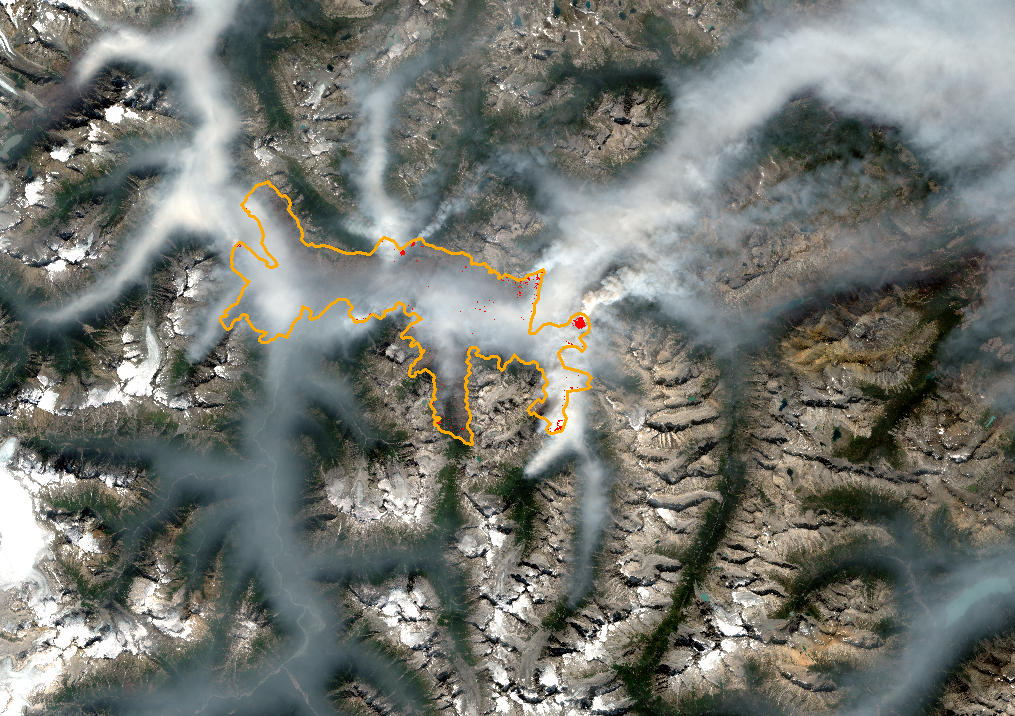
Rapid Burned Area & Severity Mapping (R-BAM)
Provides timely and accurate information on wildfire burned area and severity, complementing conventional wildfire observation and assessment techniques. R-BAM is a geo-processing pipeline hosted in our GEO Analytics Canada Platform. Sentinel-2 and Landsat-8/9 data are queried from cloud storage for the generation of a pre-fire, cloud free and snow free composite image. Similarly, post-fire data are queried, and similar compositing techniques are used. Using a Jupyter Notebook, an analyst can interact with the R-BAM workflow and refine the input image data to maximize the quality of inputs. The outputs of the service are standardized composite images, normalized burn ratio (NBR) products, fire perimeter, and burn severity classification (following provided standards/threshold). RBAM was used in 2017, 2018, and 2021 to map more than 1 million hectares affected by wildfires in British Columbia, Canada.
arboSense Forest Disturbance & Recovery
Forest ecosystems are affected by natural disturbances such as wildfires and insect attack as well as forestry operations and natural resources development. Understanding of the cumulative disturbance of the forest landscape and the effectiveness of forest recovery and restoration efforts are important for biodiversity, timber supply, water resources, and wildfire management. We provide strategic information on disturbance and recovery over large areas by analyzing long time series of satellite EO data, including detecting and assessing narrow linear features, for example assessing several caribou ranges and timber supply areas in Northeast British Columbia.
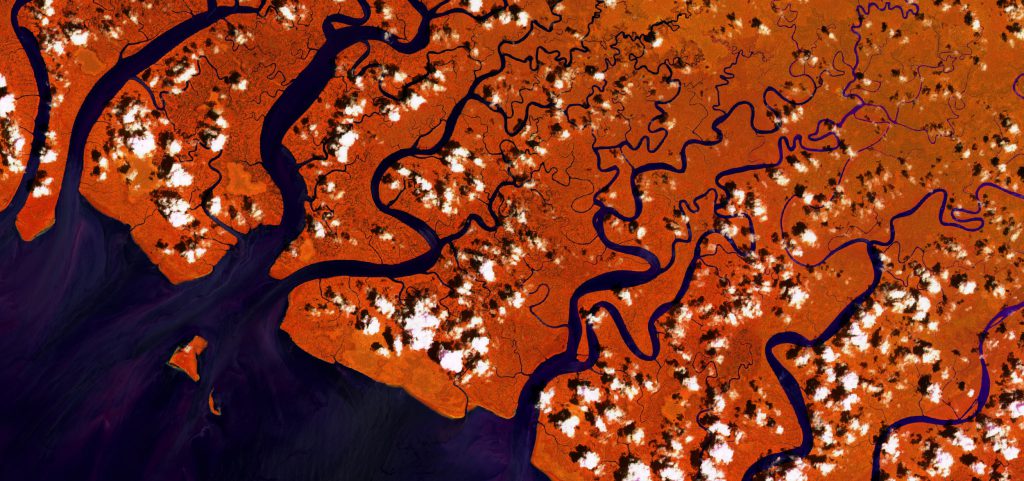
Mangrove Monitoring
Mangroves ecosystems are distributed across the tropical and subtropical regions of the world and provide important ecosystem goods and services to nature and society. Mangrove forests are under threat from both natural and anthropogenic forces. We use multi-spectral, radar, and lidar data with machine learning methods to classify and map change in mangrove ecosystems over large areas. Our mangrove experience includes Tanzania, Madagascar, Fiji, and Indonesia. Our services complement global monitoring initiatives providing more details and calibrated local information.
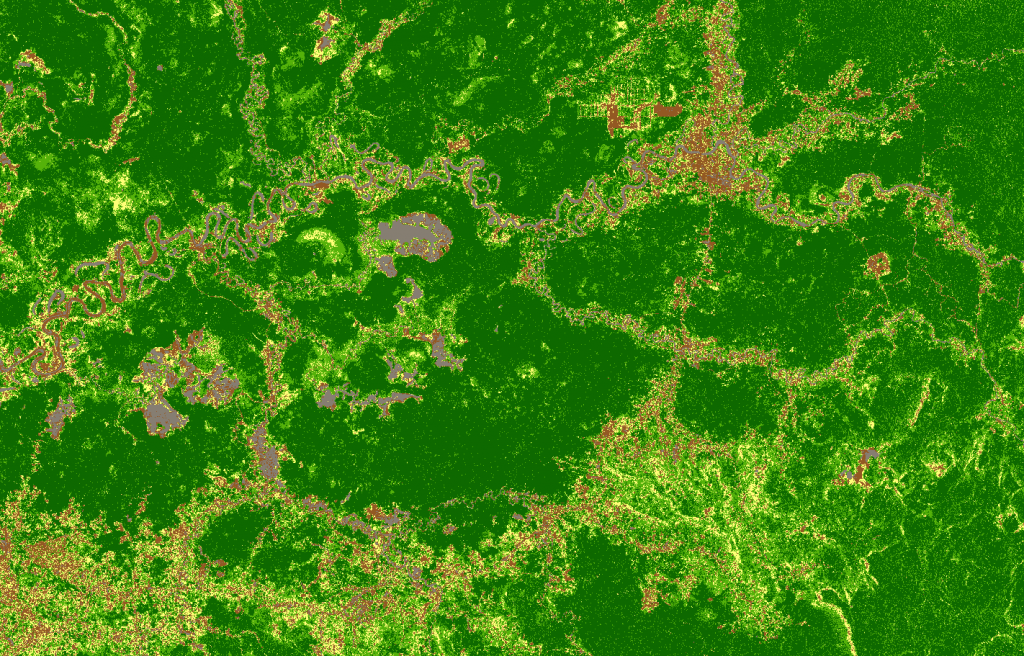
Wetland Classification
Obtaining and integrating environmental information to identify, classify and monitor wetlands is challenging. We developed object-based and machine learning classification methods that integrate multi-source and multi-temporal remote sensing data, including airborne lidar and satellite EO optical and radar data. We have mapped wetlands following the Alberta Wetland Classification System over large areas in boreal and prairie landscapes.
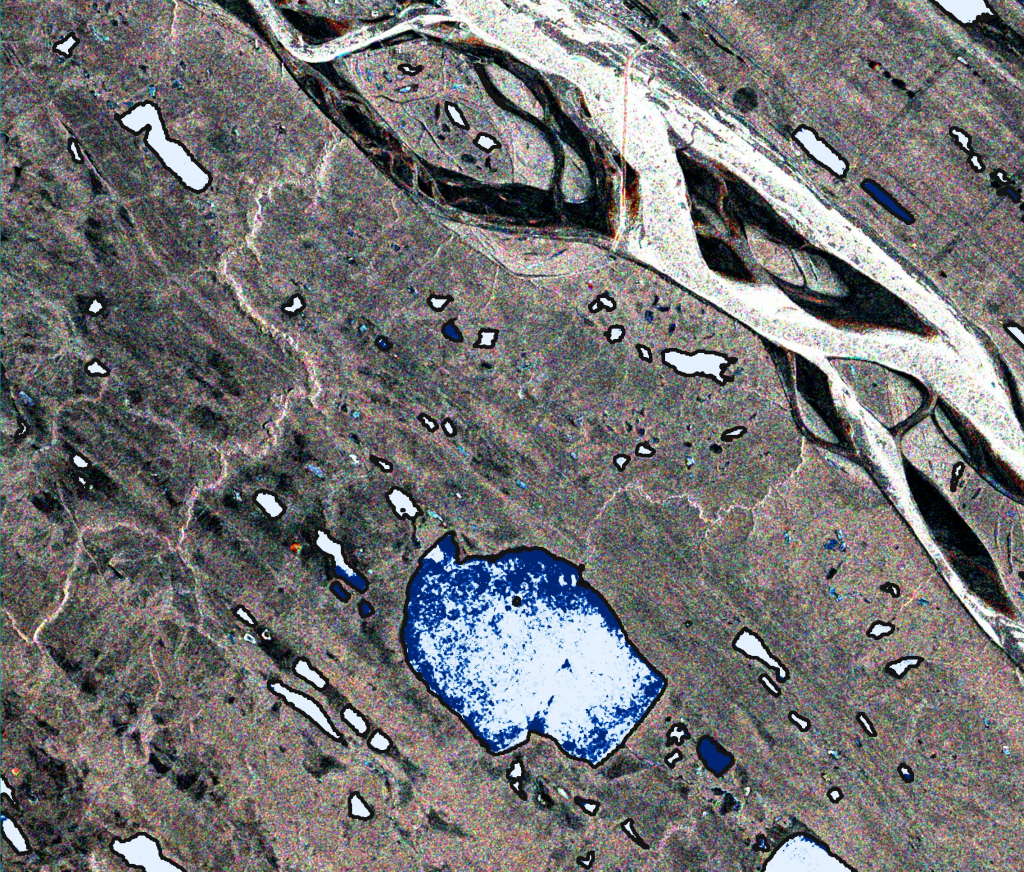
Lake Ice Classification
We developed an efficient computational technique for identifying bottom-fast ice across lakes in the Northwest Territories using multi-temporal SAR backscatter images. We used dynamic time warping (DTW), which provides a shape-based similarity metric for time series data. We used backscatter profiles from surveyed lakes with known bottom-fast ice to generate a DTW similarity metric on a pixel by pixel basis for a set of lakes. Our model categorized ice status across large areas with > 89% accuracy. Read more in our Canadian Journal of Remote Sensing article.
Land Monitoring Engine
The Land Monitoring Engine is a cloud native, open platform for Big Data geoscience that can be customized and deployed in your own cloud or HPC infrastructure.
We’re on a mission to advance satellite EO analytics and enable stakeholders to embrace this new era using cloud and high-performance computing environments.
We are trusted advisors to government, private sector, and non-government clients on the use of remote sensing technology for environmental monitoring and management around the world. We regularly support international space agencies, international finance institutions, and major energy and mining companies with scientific and strategic consulting and data analytics.
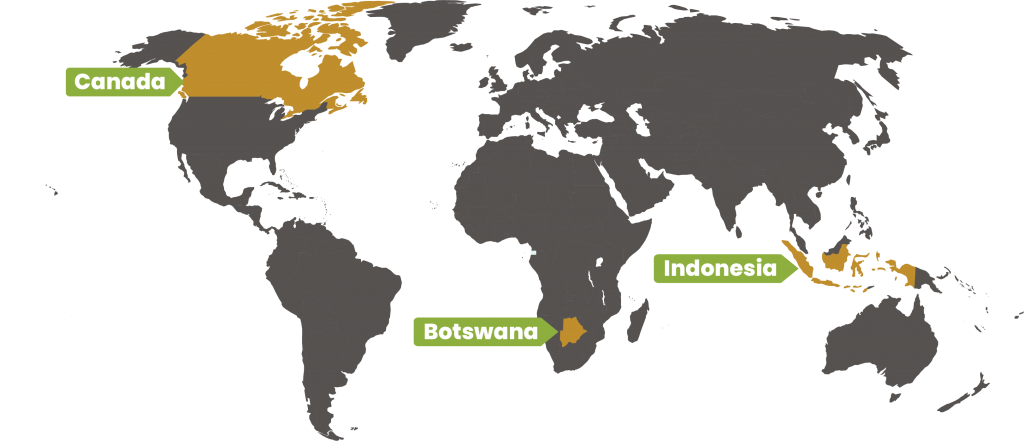
Our head office is located in Vancouver, British Columbia, Canada. We also have offices in Indonesia and Botswana. We have experience in more than 40 countries and a network of local experts around the world.
Canada
#200 – 850 Harbourside Drive North Vancouver, BC V7P 0A3